
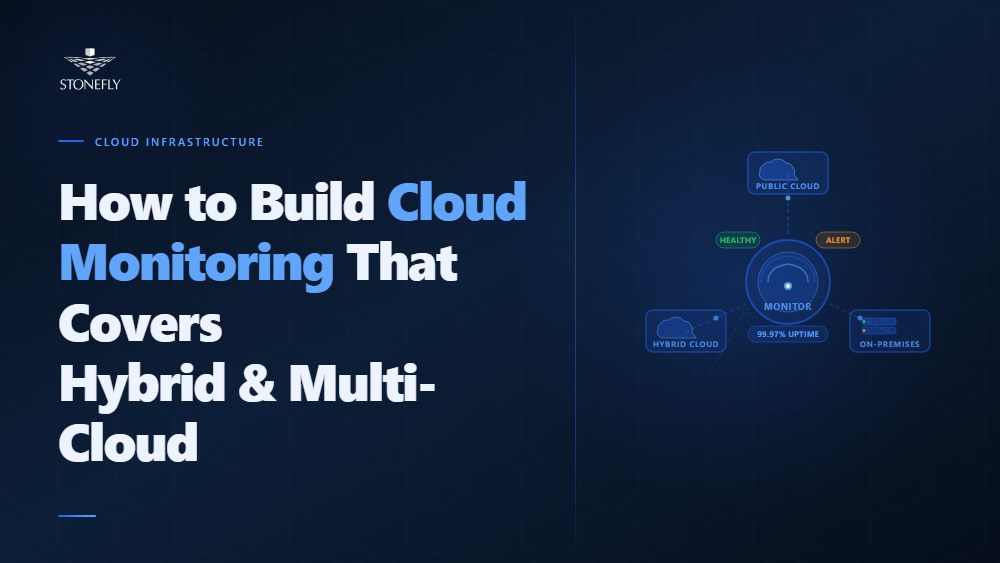
The monitoring problem in hybrid and multi-cloud environments is not a shortage of data. Most organizations are generating more telemetry than they can act on — logs, metrics, traces, and events flowing from cloud providers, on-premises infrastructure, containerized workloads, and SaaS applications simultaneously. The problem is that most of that data lives in disconnected silos. Each cloud provider’s native monitoring tool sees only its own environment. On-premises monitoring systems see only what is deployed locally. Neither has visibility into the other, and neither can correlate performance degradation, security anomalies, or cost spikes across the full environment.
The result is a monitoring architecture that is structurally incapable of answering the questions that matter most: Is this performance issue in the application layer or the infrastructure? Is this anomaly an attack or a misconfiguration? Which cloud workloads are consuming budget faster than planned? Teams discover the gaps when an incident surfaces — usually from a user complaint, not from an alert — and spend hours manually correlating data from four different dashboards that should have been unified from the start.
Effective cloud monitoring requires a deliberate architecture decision, not a default to whatever each platform provides natively. This blog covers what cloud monitoring actually needs to cover in hybrid and multi-cloud environments: the tools, the observability practices, the alerting and anomaly detection approaches, and the cost and performance monitoring disciplines that give IT teams full visibility across every layer of distributed infrastructure.
Cloud monitoring is the practice of continuously collecting, analyzing, and acting on operational data — metrics, logs, traces, and events — from cloud-based resources and the infrastructure they depend on. In a purely cloud-native environment, cloud monitoring focuses on compute instances, managed services, network traffic, storage performance, and application behavior within a single cloud provider’s environment. In hybrid and multi-cloud environments — which describe the majority of enterprise IT today — cloud monitoring must extend to on-premises infrastructure, secondary cloud providers, and the network interconnects between them.
The scope distinction matters because the tools and architectures that work well for single-cloud monitoring break down in hybrid and multi-cloud contexts. AWS CloudWatch, Azure Monitor, and Google Cloud Operations Suite are each excellent within their own provider’s environment. Each has deep native integrations, low-latency metric collection, and pre-built alerting for the services they manage. None of them has meaningful visibility into the other providers’ environments, and none has native visibility into on-premises infrastructure that the cloud workloads depend on. Building a monitoring program on any single provider’s native tooling creates structural blind spots that will become incident response problems.
Complete cloud monitoring in an enterprise context covers five layers: infrastructure monitoring (the physical and virtual compute, storage, and networking that workloads run on), application performance monitoring (response times, error rates, throughput, and latency across application tiers), security monitoring (anomalous access patterns, policy violations, configuration drift, and threat indicators), cost monitoring (resource consumption trends, budget variance, and waste identification), and capacity planning (headroom analysis and forecasting to prevent performance degradation before it occurs). A monitoring program that addresses only one or two of these layers leaves the others unmanaged.
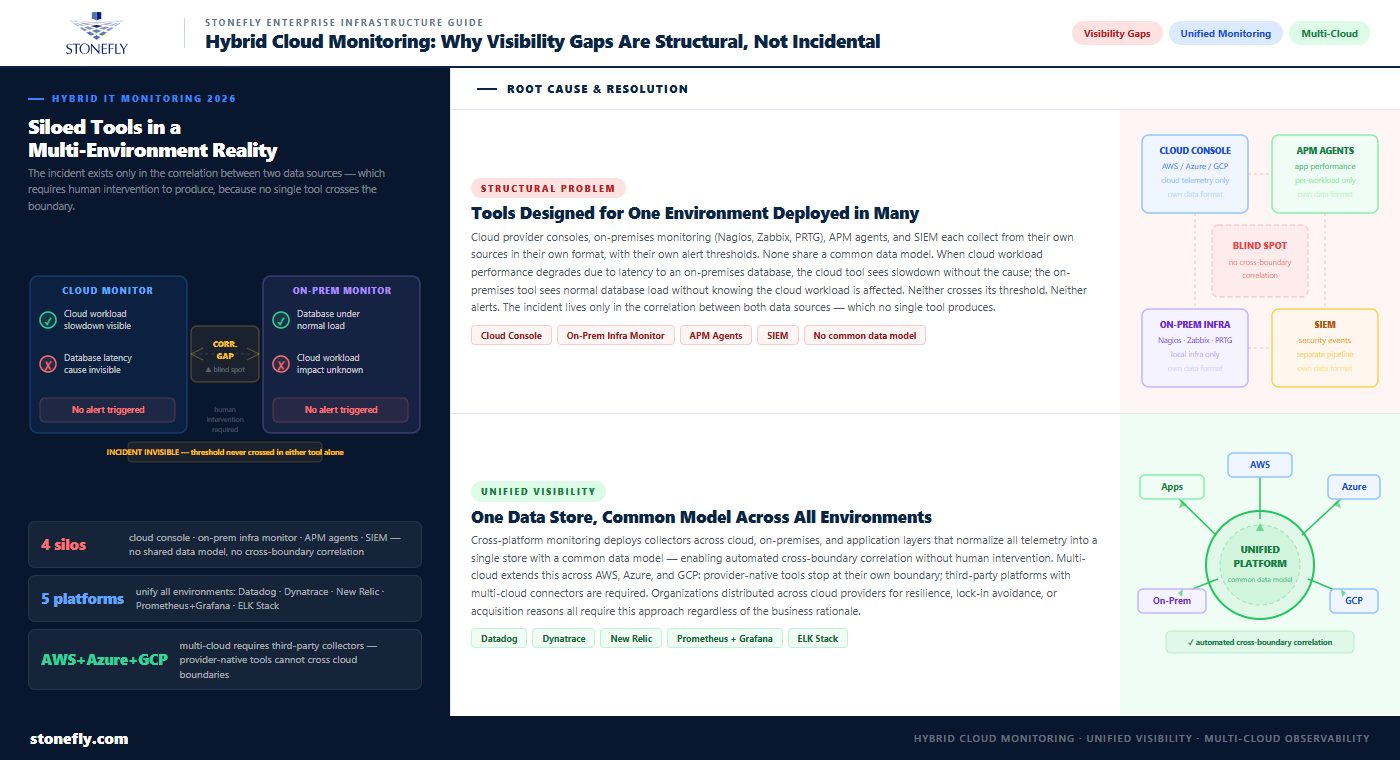
Hybrid IT infrastructure monitoring fails not because organizations lack tools but because the tools are not designed to work together. A typical enterprise monitoring environment includes the native monitoring consoles from one or more cloud providers, an on-premises infrastructure monitoring system (Nagios, Zabbix, PRTG, or similar), application performance monitoring agents deployed on workloads, and potentially a separate SIEM for security event correlation. Each of these systems collects data from its own sources in its own format, with its own alert thresholds and its own dashboard. None of them share a common data model, and none of them can correlate events across boundaries.
The visibility gap that results is not incidental — it is a consequence of deploying tools that were designed for single-environment coverage in a multi-environment reality. When a cloud workload’s performance degrades because of latency between the cloud and the on-premises database it depends on, the cloud monitoring tool sees the workload slowdown but not the database latency. The on-premises monitoring tool sees the database under normal load but does not know that the cloud workload is affected. Neither triggers an alert, because neither has crossed its individual threshold. The incident is only visible in the correlation between the two data sources — which requires human intervention to produce.
Cross-platform monitoring addresses the boundary problem by deploying monitoring agents or collectors that send data from all environments into a unified platform — one that stores, indexes, and correlates telemetry from cloud providers, on-premises infrastructure, and application layers in a single data store with a common data model. Unified monitoring platforms — Datadog, Dynatrace, New Relic, Prometheus with Grafana, and the ELK Stack (Elasticsearch, Logstash, Kibana) — each take this approach, with varying emphasis on different layers of the monitoring stack.
Multi-cloud monitoring extends cross-platform monitoring to environments where workloads are distributed across two or more public cloud providers — AWS and Azure, or Azure and GCP, or all three. The business rationale for multi-cloud varies: some organizations distribute workloads across providers for resilience, some to avoid vendor lock-in, some because acquisitions brought incompatible cloud commitments together. Regardless of the reason, multi-cloud monitoring requires agents that can collect from all providers’ environments and normalize the data into a unified format before analysis. Provider-native monitoring tools do not cross this boundary; third-party platforms with multi-cloud connectors are required.
| Tool Category | Examples | Primary Strength | Primary Limitation |
| Cloud-native monitoring | AWS CloudWatch, Azure Monitor, GCP Cloud Operations | Deep integration with provider services; low latency; no additional cost | No visibility outside own provider; poor cross-cloud and on-prem coverage |
| Infrastructure monitoring | Nagios, Zabbix, PRTG, Icinga | Broad protocol support; on-prem coverage; low cost | Limited application-layer visibility; not designed for cloud-native workloads |
| Full-stack APM platforms | Datadog, Dynatrace, New Relic | Unified cloud, on-prem, and application visibility; ML-based anomaly detection | Higher cost; agent deployment at scale adds operational overhead |
| Open-source observability stack | Prometheus + Grafana, ELK Stack, OpenTelemetry | Flexible, vendor-neutral; strong community; S3-compatible storage backends | Higher operational burden; requires expertise to build and maintain |
| SIEM / security monitoring | Splunk, Microsoft Sentinel, IBM QRadar | Security event correlation; threat detection; compliance reporting | Not designed for performance or cost monitoring; expensive at log volume |
| Cloud cost monitoring | CloudHealth, Spot.io, AWS Cost Explorer, Azure Cost Management | Granular cost attribution; budget alerts; waste identification | Limited or no performance or security data correlation |
The tool selection question in hybrid cloud monitoring is not which single tool to use but which combination of tools covers the full stack without creating more dashboard sprawl than it eliminates. The common pattern in mature enterprise monitoring programs is a full-stack APM platform as the primary unified layer (handling cloud, on-premises, and application telemetry), supplemented by provider-native tools for deep-dive diagnostics within a specific provider’s services, and a SIEM for security event processing and compliance reporting. Open-source stacks built around Prometheus and Grafana serve the same unified function for organizations with the engineering capacity to operate them.
Cloud observability is a related but distinct concept from cloud monitoring. Monitoring is reactive: it measures known indicators against defined thresholds and alerts when thresholds are exceeded. Observability is about instrumentation: it describes how well a system’s internal state can be inferred from its external outputs. An observable system is one where the telemetry it generates — metrics, logs, and traces — is sufficient to answer novel questions about its behavior without requiring code changes to add new instrumentation.
The practical significance of this distinction is that monitoring tells you something is wrong; observability tells you why. An environment where alerts fire but teams spend hours in ad hoc log searches to diagnose the cause is a monitored environment that lacks observability. The OpenTelemetry project — a CNCF-standard specification and SDK for instrumentation — has become the foundation for building observable services, providing vendor-neutral APIs for emitting traces, metrics, and logs that can be collected by any compliant backend. Investing in observability-grade instrumentation reduces mean time to resolution (MTTR) for incidents more significantly than adding monitoring coverage alone.
Real-time alerting systems in cloud environments face a fundamental calibration problem: too few alerts mean incidents go undetected; too many alerts mean on-call teams habituate to alert fatigue and start ignoring them. The failure mode for both extremes is the same — a critical incident is missed. Building alerting that produces signal rather than noise requires moving beyond static threshold alerts toward dynamic, context-aware alerting that distinguishes genuine anomalies from expected variation.
Static threshold alerts — CPU above 80%, disk above 90% — are appropriate for conditions where the threshold is known and meaningful regardless of context. Dynamic workloads, seasonal traffic patterns, and microservice environments where hundreds of services run simultaneously make static thresholds unmanageable. The alternative is baseline-relative alerting: the system learns normal behavior patterns for each resource or service and alerts when the observed value deviates significantly from the established baseline. This approach catches anomalies that static thresholds miss (a workload that normally runs at 20% CPU spiking to 60% is more significant than a workload that normally runs at 75%) while reducing false positives from expected peaks.
Anomaly detection systems in cloud monitoring platforms use statistical and machine learning methods to identify behavior that deviates from expected patterns without requiring human-defined thresholds for every metric. ML-based anomaly detection is particularly valuable for high-cardinality monitoring environments — microservice architectures with hundreds of services, each emitting dozens of metrics — where manual threshold management is not scalable. Datadog’s Watchdog, Dynatrace’s Davis AI, and New Relic’s Applied Intelligence are commercial implementations of this approach; open-source options include Facebook’s Prophet for time-series anomaly detection and the ADTK library for Python-based implementations.
The limitation of automated anomaly detection is that it requires sufficient historical data to establish meaningful baselines — typically 2–4 weeks of data for seasonal workloads — and it generates false positives during baseline learning periods and after infrastructure changes. Anomaly detection works best as a supplemental layer on top of static threshold alerts for known failure conditions, not as a replacement for deliberate alert design. The most effective alerting architectures combine static thresholds for conditions with known criticality, dynamic baseline alerts for workload anomalies, and anomaly detection for the long tail of behavioral deviations that neither threshold approach would catch.
Incident monitoring tools that integrate alerting with incident management — PagerDuty, Opsgenie, VictorOps — add escalation routing, on-call schedules, and incident tracking to the alerting layer, ensuring that alerts reach the right team at the right time and that incident response is tracked and documented. The integration between the monitoring platform and the incident management tool is where many organizations lose context: an alert fires, the on-call engineer resolves the incident, but the resolution is never correlated with the original alert in the monitoring system. Closing that loop — linking alerts to incidents to resolutions — builds the operational history that improves future alert calibration.
Cloud security monitoring is distinct from performance monitoring in its data sources, analysis methods, and response requirements, but it shares the same fundamental cross-environment visibility problem. Security events of significance — a credential compromise, a lateral movement attempt, an unauthorized configuration change — rarely announce themselves clearly in a single system’s logs. They become visible only when events across multiple systems are correlated: an unusual login from a new geography, followed by API calls enumerating storage buckets, followed by a large outbound data transfer, each of which is individually ambiguous but collectively indicative of exfiltration.
Cloud security monitoring requires coverage across four categories: identity and access monitoring (who is authenticating, from where, to what, and whether the pattern is consistent with established behavior), configuration drift monitoring (cloud resource configurations checked against security baselines to detect unauthorized changes), network traffic analysis (VPC flow logs, DNS queries, and east-west traffic patterns analyzed for indicators of compromise), and workload runtime monitoring (process execution, file system changes, and system calls within running workloads checked against expected behavior).
Security monitoring best practices for cloud environments start with log centralization: all CloudTrail, Azure Activity Log, GCP Audit Log, VPC flow log, and application log data consolidated into a single indexable store. Without centralized logs, correlation across environments requires manual effort that scales poorly and slows response. A centralized log store — whether a commercial SIEM, a self-hosted ELK stack, or cloud-native options like AWS Security Lake — is the prerequisite for any cross-environment security monitoring program.
Beyond centralization, cloud monitoring best practices for security include: enabling logging at every layer where it is available (many organizations run cloud workloads with audit logging disabled or limited, creating blind spots); establishing configuration baselines and monitoring for drift using tools like AWS Config, Azure Policy, or open-source alternatives like Cloud Custodian; and integrating threat intelligence feeds into the alert evaluation layer so that known malicious IP addresses, domains, and file hashes are flagged automatically rather than discovered retrospectively. Response time is the critical metric in security monitoring — reducing the gap between detection and containment is what limits breach impact, and that reduction comes from automated detection and pre-defined response playbooks, not from manual log review.
Cloud performance monitoring at the application layer focuses on the metrics that reflect user experience: response time, error rate, throughput, and availability. These application performance metrics are the output indicators that connect infrastructure health to business impact — a 300ms increase in average response time is directly correlated with user abandonment rates in transactional applications, and that correlation gives infrastructure teams the business context to prioritize performance remediation over other work.
Response time monitoring in distributed systems requires tracing, not just aggregate metrics. A request that passes through a load balancer, three microservices, a cache, and a database before returning a response may have acceptable aggregate response time while one segment — the cache miss path, for instance — has unacceptable latency. Distributed tracing tools — Jaeger, Zipkin, and commercial implementations in Datadog APM and Dynatrace PurePath — attach a trace context to each request and capture timing data at every service boundary, enabling latency attribution to specific system components rather than distributed blame across the architecture.
Cloud cost monitoring has become a first-class monitoring function as cloud spending has grown from a small portion of IT budget to a dominant one. The core problem cloud cost monitoring addresses is that cloud consumption is variable and automatically provisioned — developers and automated scaling policies can spin up resources that generate significant cost without any procurement approval. Without continuous cost monitoring, cost anomalies accumulate over weeks before they surface in billing, at which point the root cause is difficult to identify and the charges are already committed.
Effective cloud cost monitoring requires cost attribution at granular levels — by service, by environment (production vs. development vs. test), by team, and by workload — so that anomalies can be traced to their source. Tag enforcement is the operational prerequisite: all cloud resources must be tagged with the metadata needed to attribute cost accurately. Without consistent tagging, cost data is an aggregate that cannot be actionably analyzed. Budget alerts — notifications when spending in a cost category crosses a defined threshold — provide the real-time signal that catches anomalies before they become billing surprises.
Cloud performance optimization and cost optimization intersect at right-sizing: ensuring that cloud resources are sized for actual workload requirements rather than peak theoretical demand. Most cloud resources are overprovisioned — provisioned at a size chosen conservatively to handle anticipated peak load that rarely materializes. Monitoring data (CPU utilization, memory usage, network throughput over time) is the input for right-sizing analysis. Organizations that implement continuous right-sizing reviews, informed by monitoring data, typically find 20–40% of cloud compute resources are candidates for downsizing without performance impact.
Capacity planning monitoring uses current utilization trends to forecast when resources will approach capacity limits — before those limits are reached. The output of capacity planning is lead time: knowing that a storage volume will reach 85% utilization in 45 days gives the operations team time to expand capacity on schedule rather than in an emergency. Without capacity forecasting, capacity additions are reactive — triggered by performance degradation or alerts — rather than proactive.
System health monitoring dashboards that surface capacity trends alongside current performance metrics enable operations teams to act before thresholds are crossed rather than after. Monitoring data visualization tools — Grafana being the most widely deployed open-source option — provide the dashboard layer that makes capacity trends visible across the organization, not just to the engineers running the monitoring systems. Well-designed monitoring dashboards show current state and trend direction for the metrics that matter, organized by the audience consuming them: an executive health summary and an on-call engineer’s operational detail view require different data presentations from the same underlying monitoring data.
The infrastructure that cloud monitoring programs observe — on-premises compute, storage, and networking in hybrid environments — needs to be both observable itself and capable of supporting the data infrastructure that monitoring platforms depend on. StoneFly’s enterprise storage and compute platforms are designed to integrate with industry-standard monitoring tools while providing the scalable storage backend that observability data at enterprise scale requires.
StoneFly’s USS (Unified Storage and Server) delivers hyperconverged on-premises compute and storage infrastructure that integrates with hybrid monitoring architectures via industry-standard protocols. USS nodes expose system health metrics through standard monitoring interfaces — SNMP, REST APIs, and agent-based integrations — compatible with Datadog, Prometheus, Zabbix, and other monitoring platforms. For IT teams running hybrid cloud monitoring that needs full visibility into on-premises infrastructure alongside cloud workloads, USS’s monitoring integration ensures that on-premises HCI performance data appears in the same unified dashboards as cloud metrics, eliminating the on-premises blind spot that dedicated cloud monitoring tools create.
StoneFly’s USO (Unified Scale-Out SAN, NAS, and S3 Object Storage) addresses a different dimension of the monitoring infrastructure problem: where to store the observability data that monitoring systems generate. At enterprise scale — thousands of services, dozens of metrics per service, log retention requirements of 90 days or more — monitoring data volumes can reach petabyte scale. USO provides an S3-compatible object storage endpoint that serves as the backend for Prometheus long-term storage (via Thanos or Cortex remote write), Elasticsearch index storage, and log archive targets for SIEM platforms. Deploying on-premises object storage for monitoring data eliminates the cloud egress costs that come with centralizing large log volumes in cloud-based object storage, while maintaining the S3 API compatibility that monitoring tools expect.
For organizations running hybrid IT infrastructure monitoring that spans on-premises StoneFly infrastructure and cloud workloads, the combination of USS for production compute and USO for monitoring data storage provides an on-premises foundation that integrates cleanly with cloud-native monitoring tools without the vendor lock-in or egress costs of an all-cloud observability approach.
Enterprise IT teams evaluating cloud monitoring architecture for hybrid and multi-cloud environments can explore StoneFly’s USS and USO platforms at stonefly.com/products, or contact StoneFly to discuss monitoring integration and observability data storage requirements for specific infrastructure configurations.
The organizations that solve cloud monitoring in hybrid environments successfully are not the ones that find the best single tool — they are the ones that design for unified visibility from the start. That means making conscious decisions about telemetry collection layers, log centralization, alert design, and cost and performance data correlation, rather than defaulting to each platform’s native monitoring tools and inheriting the blind spots that come with them.
The investment pays out in three ways. Faster incident response: unified monitoring with cross-environment correlation reduces the time between alert and root cause identification from hours to minutes. Lower costs: continuous cost and performance monitoring with right-sizing analysis routinely surfaces 20–40% savings in overprovisioned cloud resources. Better capacity planning: trend-based capacity forecasting converts capacity expansions from emergency responses into scheduled activities that do not interrupt operations.
Building toward that outcome requires addressing the monitoring architecture systematically — starting with telemetry unification, layering in observability instrumentation, designing alerting that produces signal, and adding cost and security monitoring as coequal disciplines alongside performance monitoring. The infrastructure that runs those workloads — on-premises HCI, scale-out object storage for monitoring data — is part of the architecture, not an afterthought.
Contact StoneFly to discuss how USS and USO can support your hybrid cloud monitoring infrastructure — from observable on-premises compute to scalable observability data storage.

Join our mailing list to receive the latest news, updates, and promotions from StoneFly.